23 Aug Weekly Forex Technical Analysis & Price Action Review ( 24th – 28th August 2020)
Forex Weekly Technical Chart Analysis
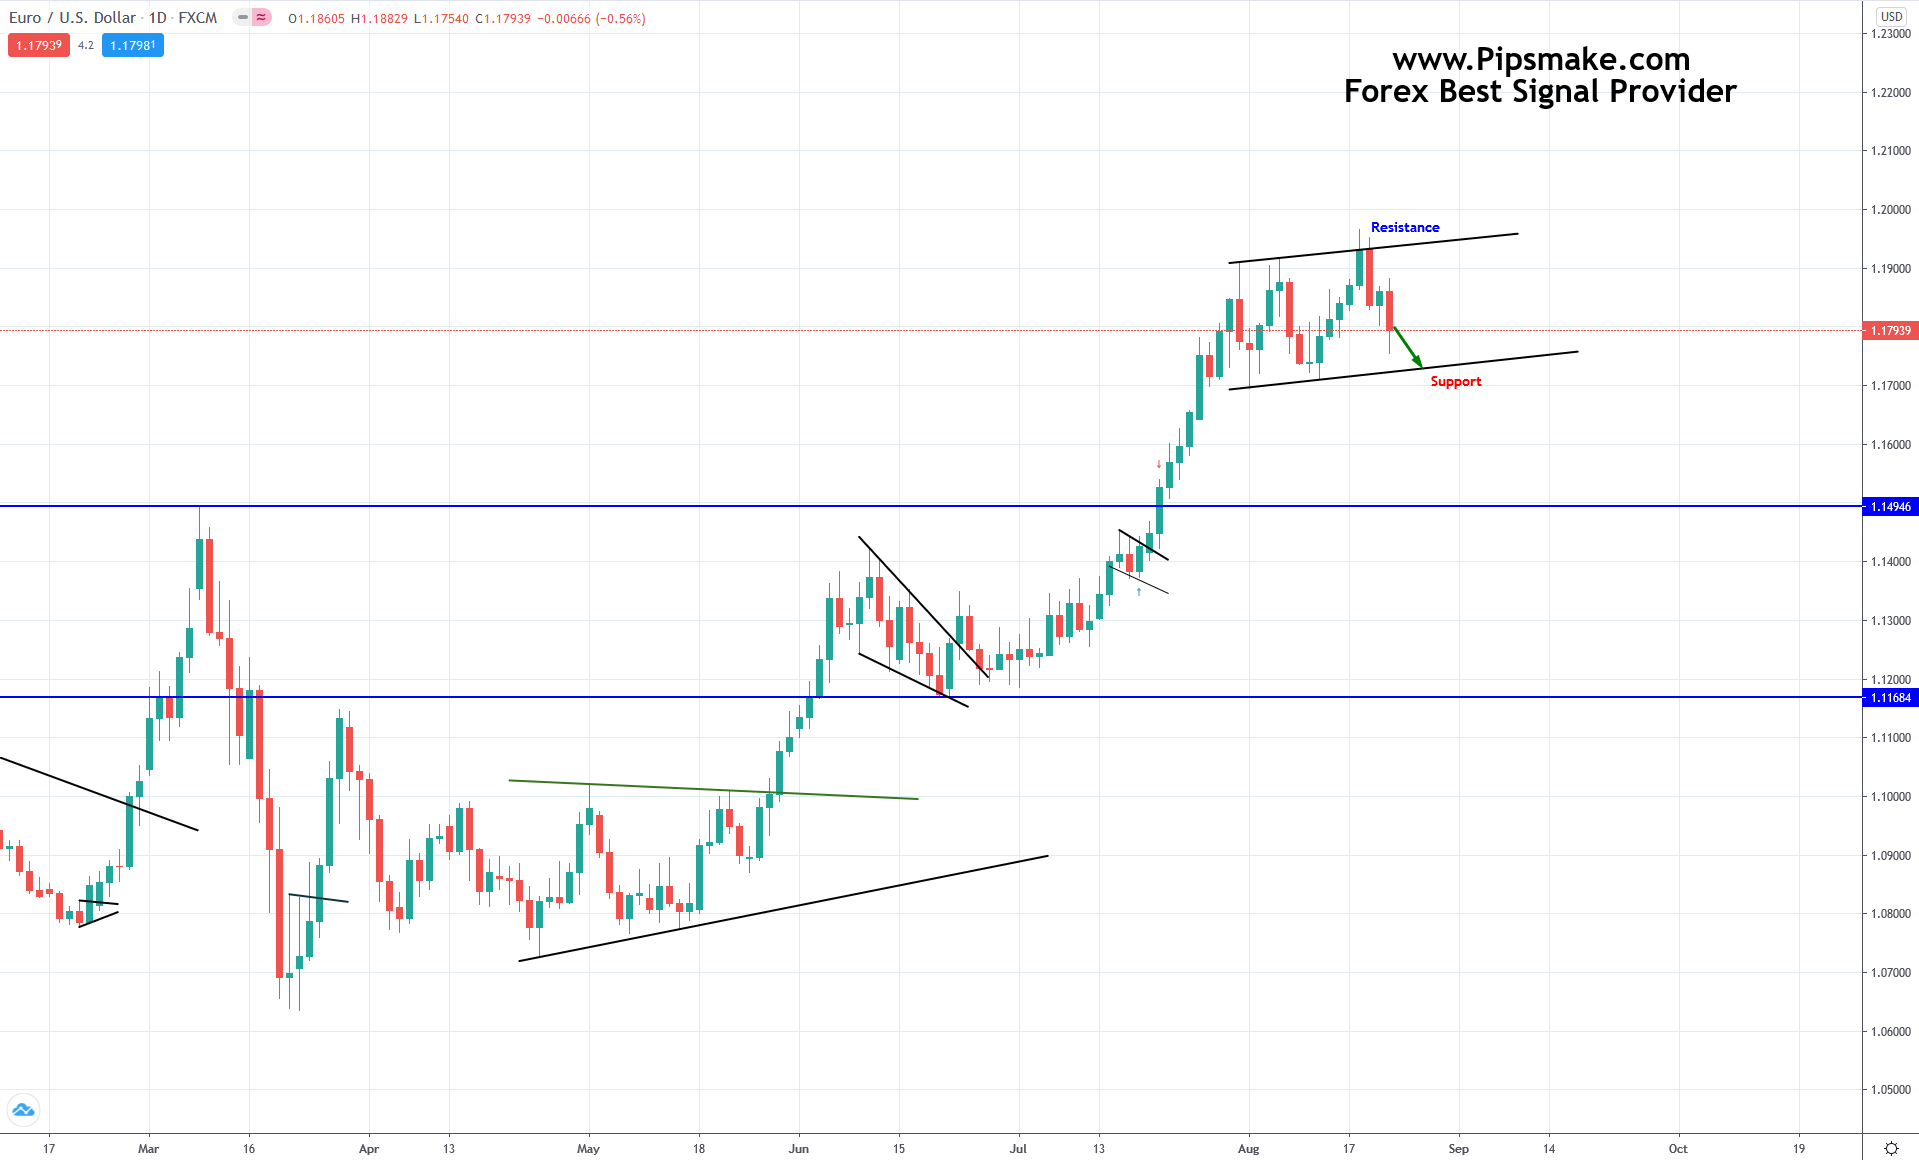
EURUSD on the Daily chart retraced till the 0.618 of the previous move and hit the dynamic monthly descending trend-line .As we can see from the weekly chart the trend-line rejected perfectly the bullish move and price created for the first time after weeks a red candle.We can expect further retrenchment and we will check for possible entries in the market only above or below the weekly structures that will give us confirmation of possible new trend.You can join our with paid signal channel on Telegram we have been the most consistent reliable Forex Signals service in world. Join us and change your life. If you want daily profit then you can join with us and get 90% profitable trade always. For more info about our paid group > inbox us or select our service package Click here Forex Signal, Forex Trading , Forex Best Signal Provide
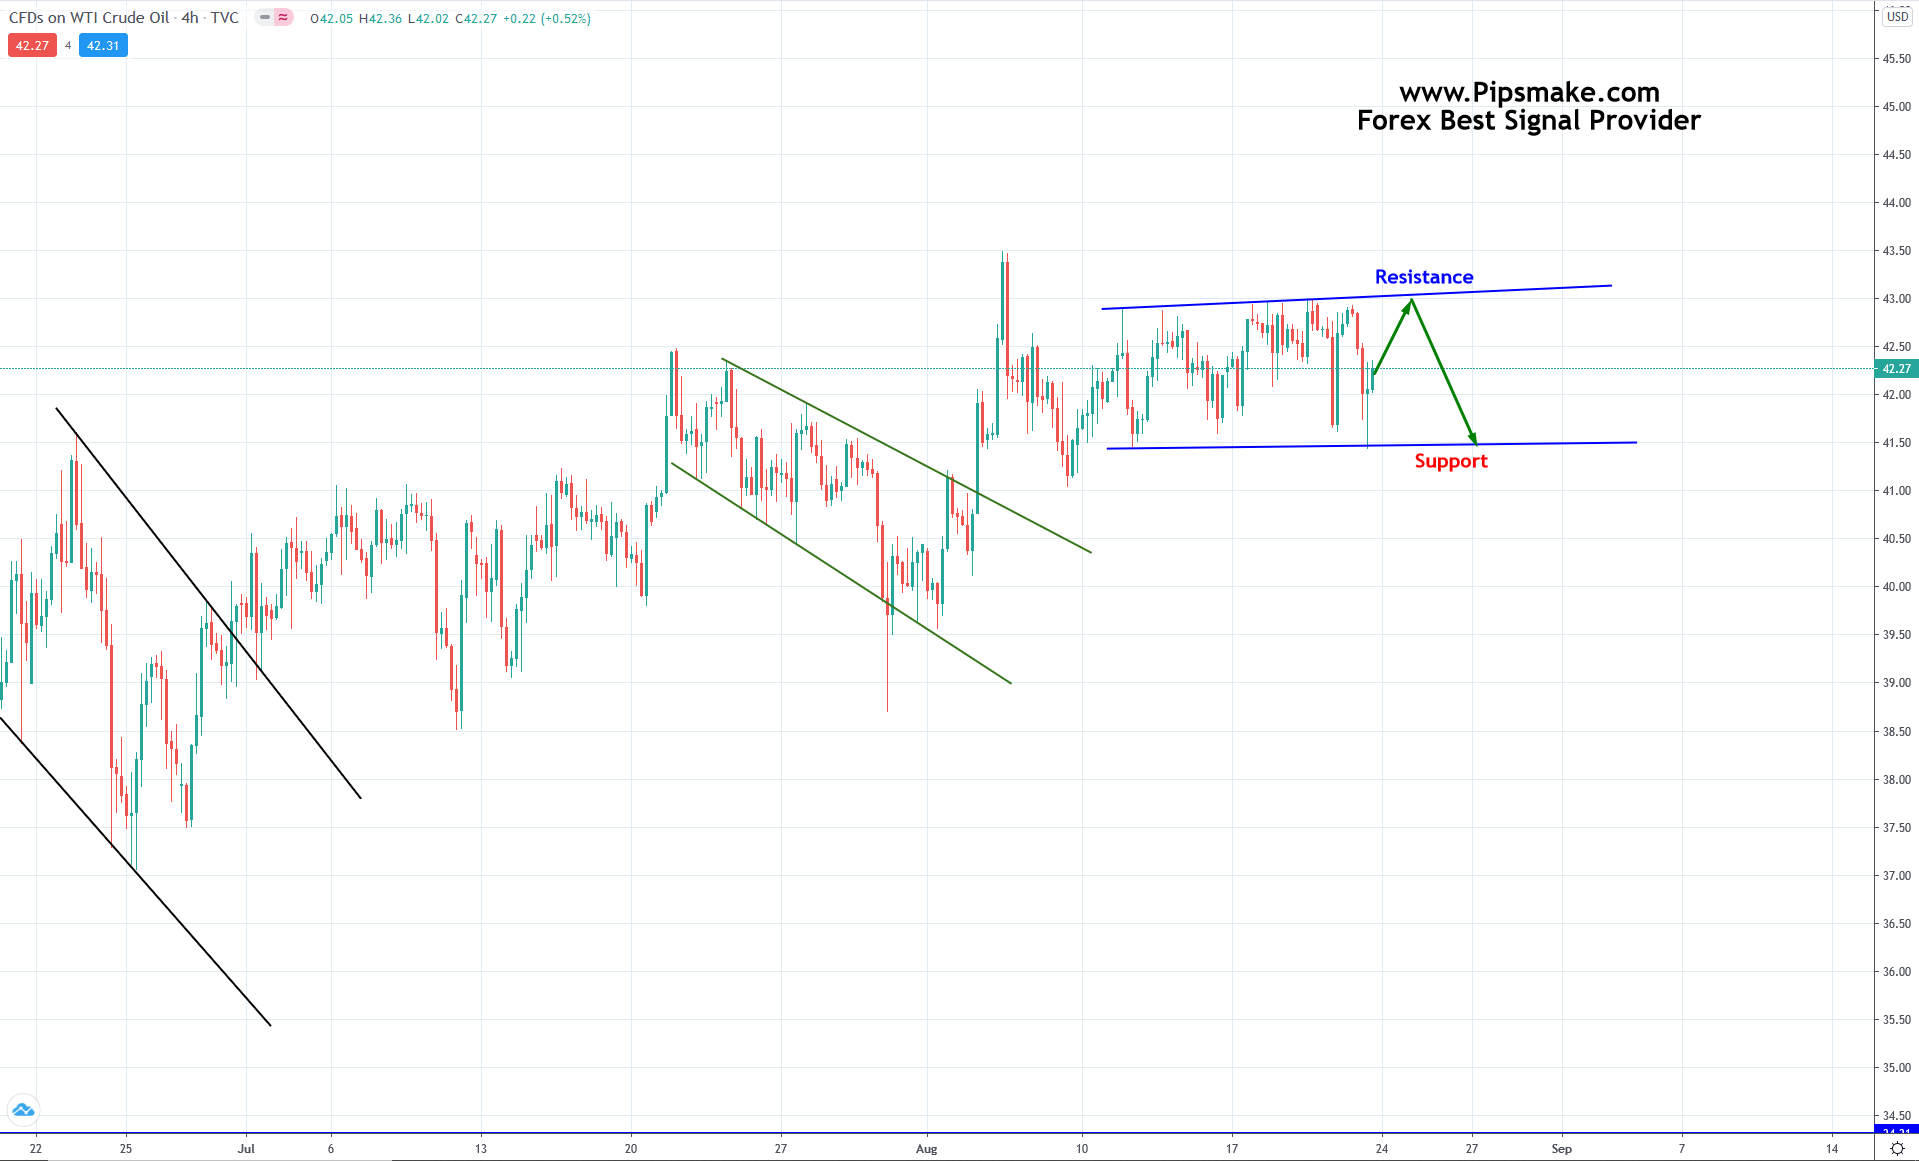
Crude Oil on the monthly chart is still below the strong monthly resistance.On the weekly chart we can see that market is in a consolidation phase and we can expect the price to reach the 45 area.As in the drawings some retrenchments in in the range between 38 and 42 can happen before the break above the monthly structure.
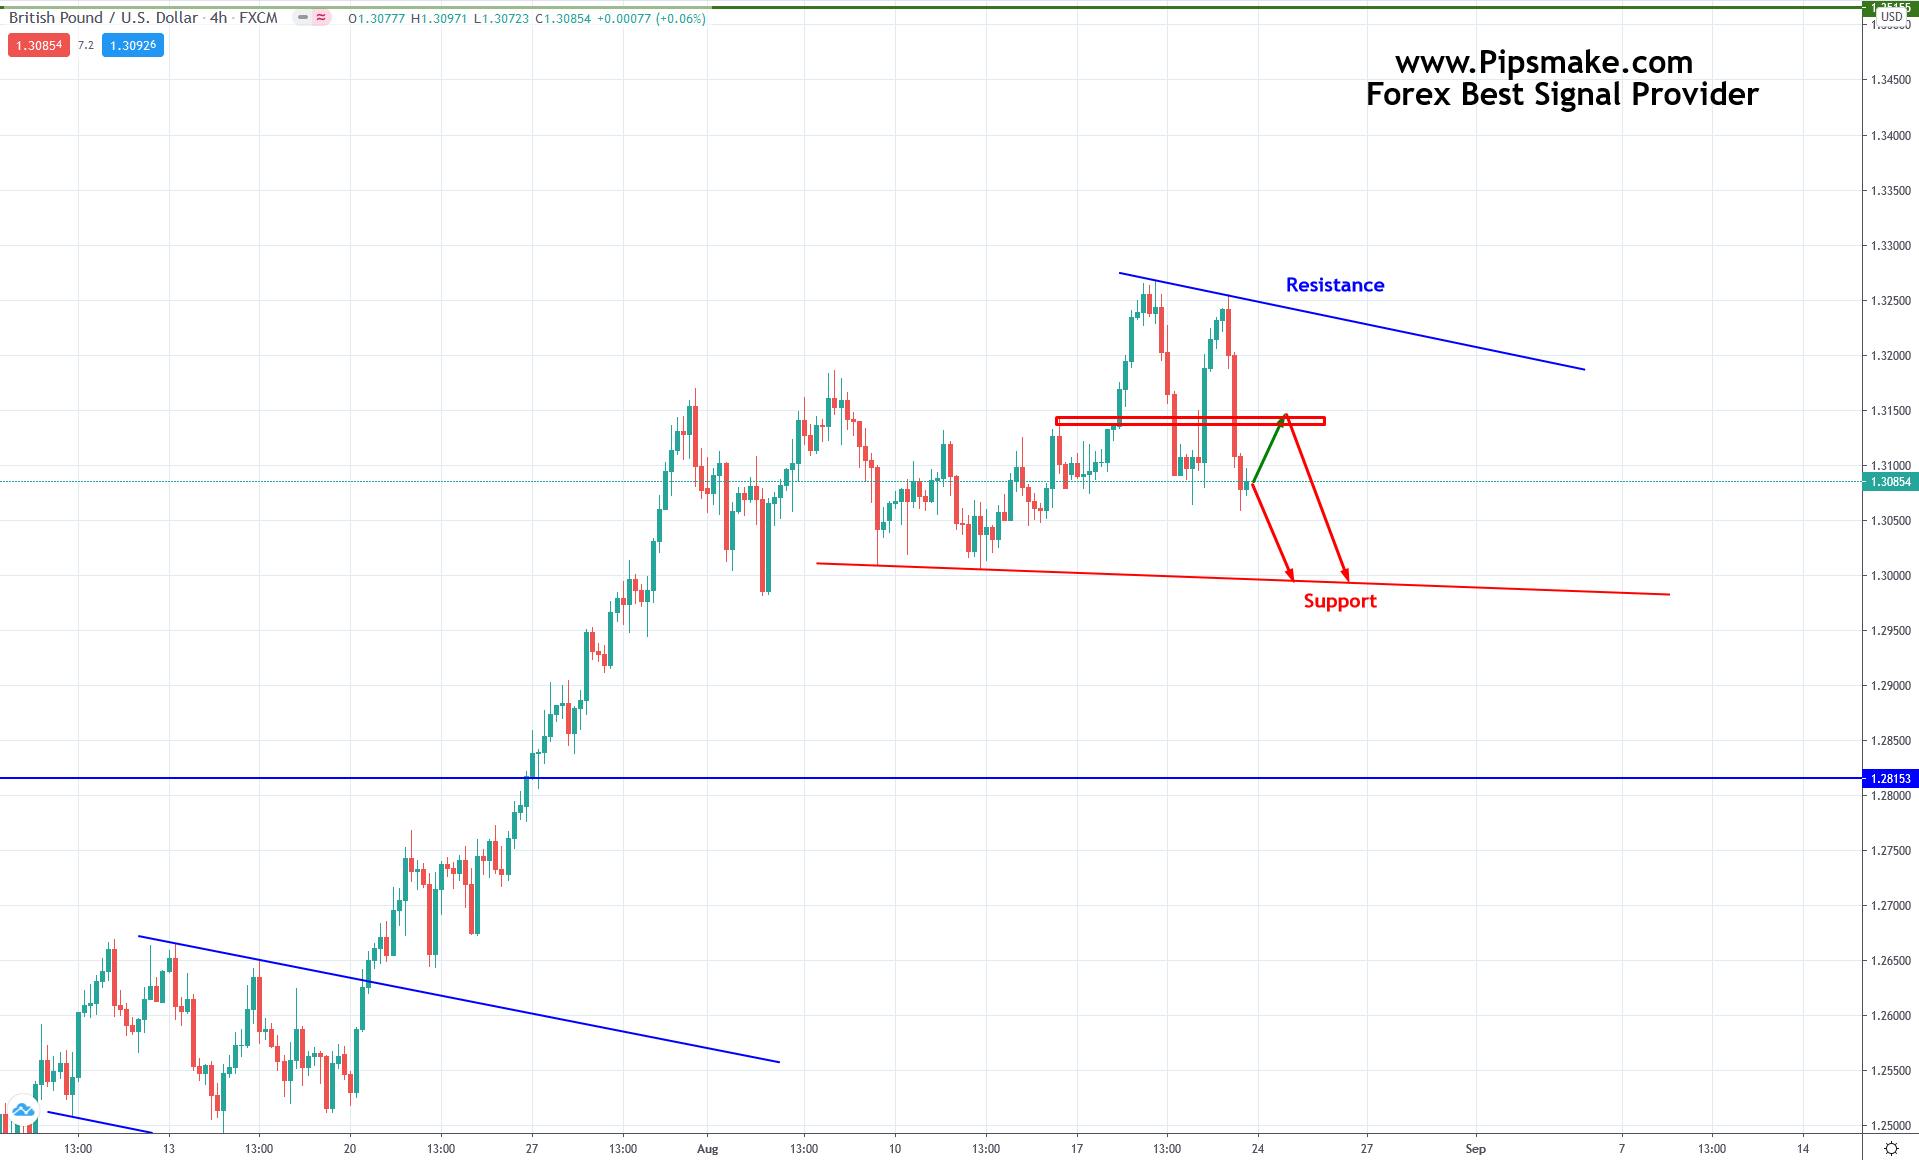
GBPUSD Still now in Sell Mode. So You can find a short sell entry from this place.You can join our with paid signal channel on Telegram
You can Signup in our website and get 1 week Free Forex Signal and life time Price action analysis.
If you want daily profit then you can join with our Paid Group for more info Inbox us.
We Provide you 90% accurate Best Forex Signal , Forex Signal Service every day. So join with us and enjoy green pips every day.
Good luck Traders.
Regards,
Pipsmake Team