
12 Nov Weekly Forex Forecast (November 13 – 17, 2017)
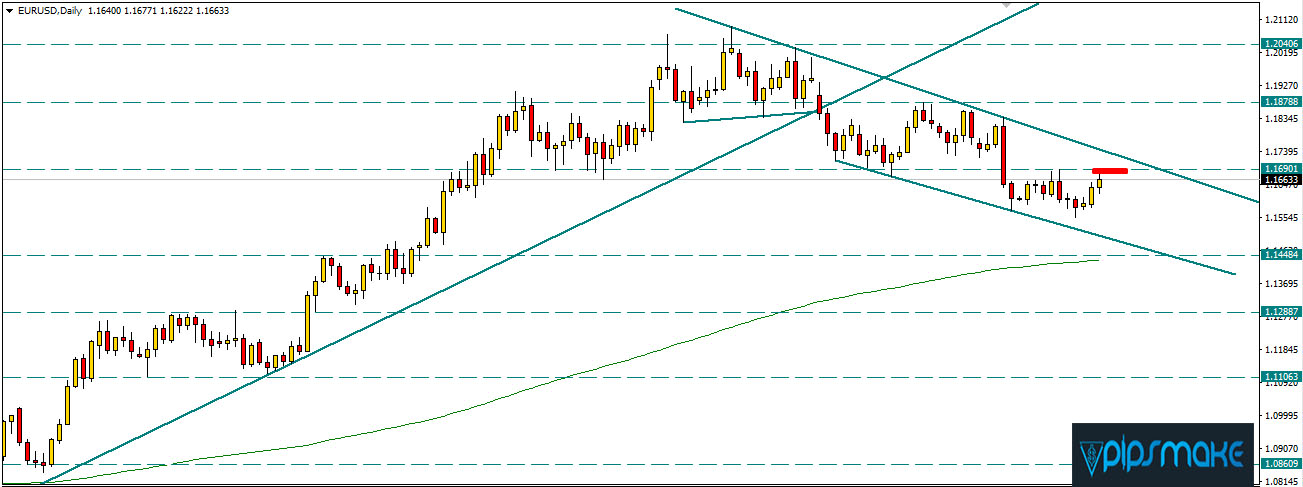
The EURUSD finished last week just below a ‘make or break’ resistance level at 1.1670. It’s an area that served as resistance between the 21st and 25th of July and immediately transitioned to support following the July 26 breakout.
It’s also the neckline of what is believed to be a head and shoulders reversal. Sellers confirmed the 420 pip reversal pattern on October 26. They even followed through shortly after the break below 1.1670, yet have struggled in recent sessions.The future direction of the single currency will likely come down to the 1.1670 handle. As long as the pair remains below it on a daily closing basis at 5 pm EST, the bearish scenario is alive and well.As for support, the first key level comes in at 1.1490 followed by 1.1300. The latter is the objective of the head and shoulders pattern.Alternatively, if EURUSD bulls manage a daily close back above 1.1670, we could see the pair return to key resistance at 1.1875.I still have two short positions open here. The first was from the retest of 1.1875 resistance and the second from the November 3 retest of new resistance at 1.1670. The latter is just better than breakeven at the time of this writing.I intend to add a third position on a daily close below 1.1490. But as I mentioned above, it’s going to come down to whether or not the 1.1670 area can attract enough offers to keep buyers at bay. If it doesn’t, the odds of a move lower will begin to look pretty slim.
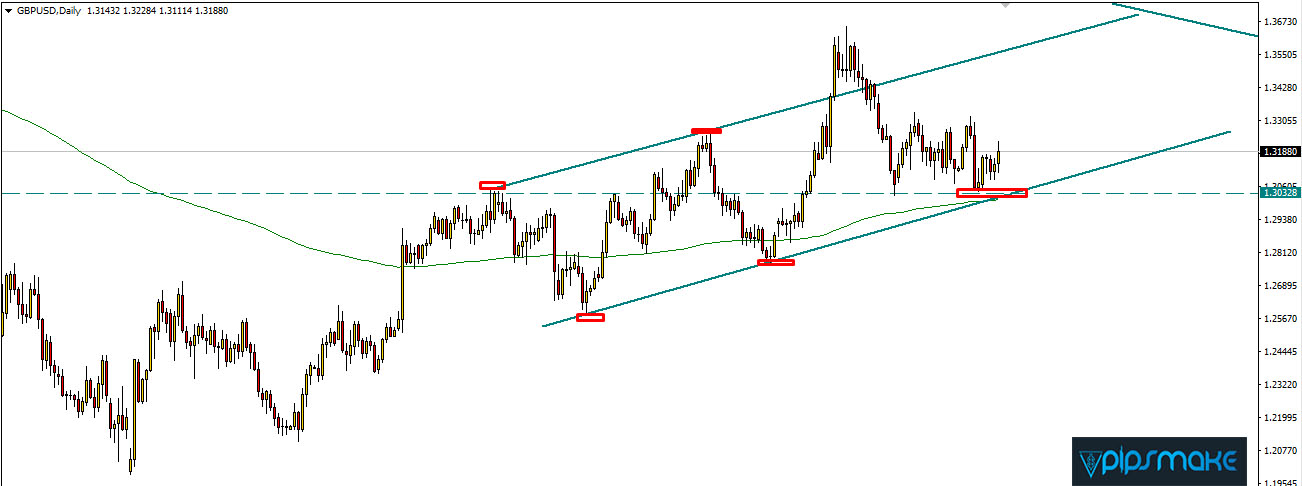
GBPUSD bulls held onto ascending channel support last week. It’s a level that extends from the March low and will be instrumental in determining the path forward for the pound sterling.
To the upside we have a familiar resistance level. The 1.3290 area has held buyers in check since October 3. We’ve had intraday spikes above the level, but the pair has yet to manage a daily close above it since late September.So we’re back to watching and waiting for the GBPUSD to make its move. As I mentioned a couple of weeks ago, the terminal pattern that has formed as a result of trend line resistance and channel support will be the deciding factor going forward.Those two levels intersect at some point in late November, perhaps even December. So, sometime between now and then, the pair has a big decision to make. Either break above the 2014 trend line or below ascending channel support from the March low.Either way, the outcome could offer one of the best opportunities of 2017. In fact, a breakout from the terminal pattern will likely have repercussions that extend well into 2018.In the short-term, however, the GBPUSD is range bound between 1.3100/20 support and 1.3290 resistance. We can use these areas to watch for price action signals until the pair reaches the termination point.
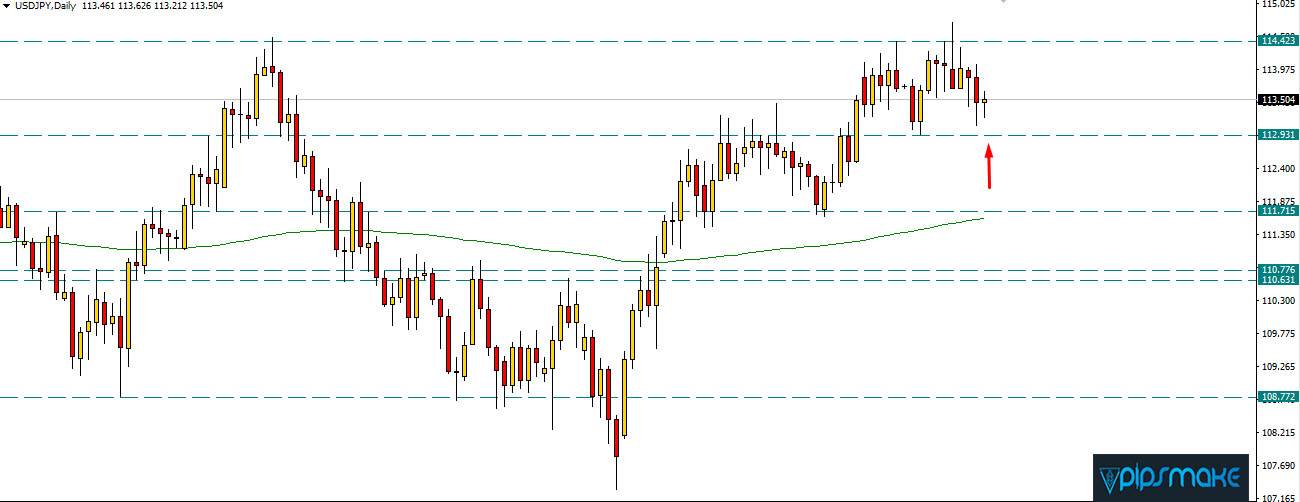
The USDJPY, like many other currency pairs, has been range bound for several weeks. It seems the indecision around Trump’s tax plan among other things is preventing the pair from breaking loose.
A look at the technical shows a key support area at 113.15. To the upside we have the 114.35 handle that has directed price action since May.As long as buyers keep prices above 113.15 on a daily closing basis (5 pm EST), the bullish scenario must be respected. Key resistance comes in at 114.35 followed by 115.40.If buyers fail to do so, there’s a high chance of a move back toward 111.60 and perhaps even the range lows near 108.20.Keep in mind that the implications of this range break will overflow to other Japanese yen pairs. That includes the EURJPY which we’ll discuss momentarily. While it isn’t a pip-for-pip relationship, the direction of the USDJPY does tend to spill over to its counterparts.
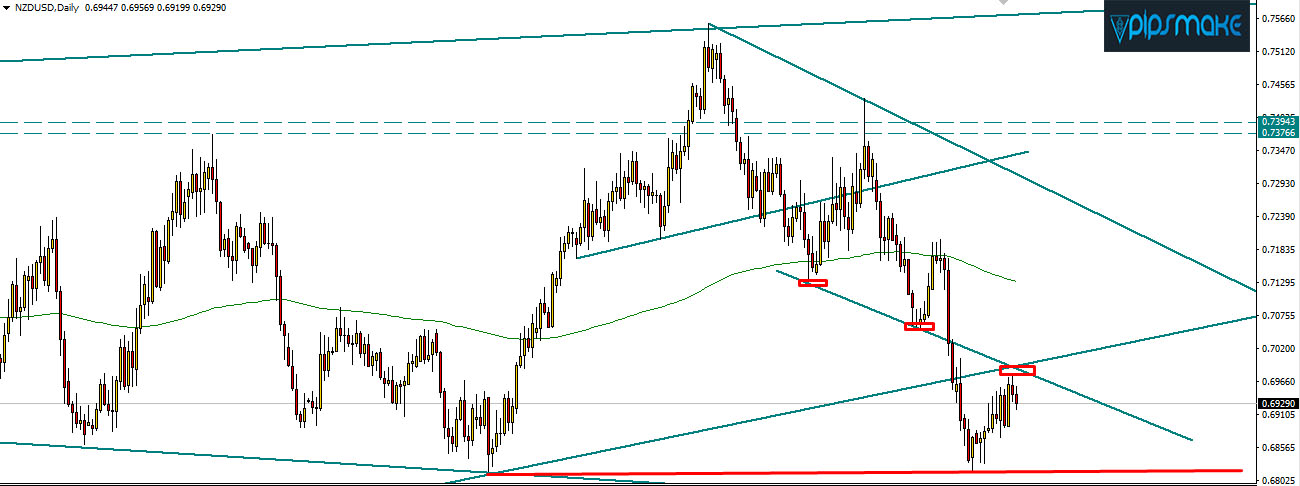
I’ve mentioned the NZDUSD a few times in recent weeks. First was the October 23 break of trend line support. It’s a level that dates back to September of 2015.
The second mention came on November 3 followed by last Thursday the 9th. These commentaries focused on the confluence of resistance at 0.6985. It’s the intersection of three different levels.First up is the trend line I mentioned last month. The trend line that extends from the September 2015 low is well worn and helped attract offers on the 23rd and 24th of October.Next is the horizontal level at 0.6985. While it isn’t as apparent from recent price action, a look at the weekly chart shows how it served as a pivot between April and July of last year. It’s also the 38.2% Fibonacci retracement from the 2015 low to the 2017 high.Last but not least is the descending channel that spanned the July 27 high at 0.7558 to the October 19 low at 0.7009. It’s more obscure than the other two levels but just as important. The channel floor was broken on October 20 session and should now attract sellers.Friday appears to have broken an intraday wedge that’s visible on the 4-hour chart. As such, I will be on the lookout for a selling opportunity on a retest of the 0.6940/50 area as new resistance.Key support comes in at 0.6820 with a daily close below that exposing the May low at 0.6675. As long as 0.6985 holds as resistance on a daily closing basis (5 pm EST), I will remain bearish the NZDUSD.
 We start our Paid Trading signal service.
If you want this Signal then you can join with our paid Service.
90% profitable trading system.
If you interested about it then join with us click here